Portfolio / AI Automation / Executive KPI & Operations Dashboard
Executive KPI & Operations Dashboard
One trustworthy screen for the numbers that run the business — with AI notes on what moved.
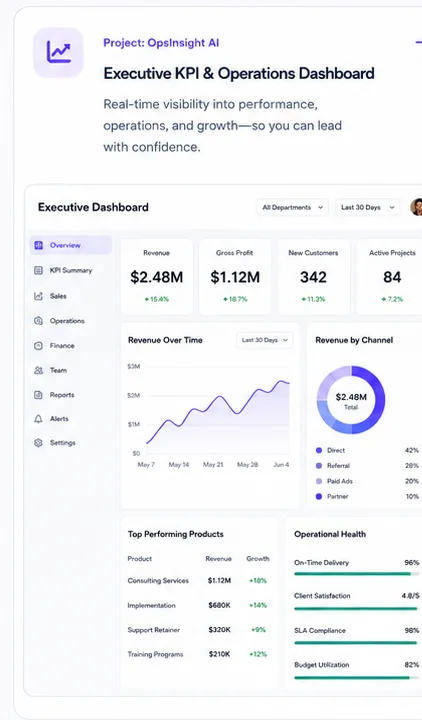
Selected concept work demonstrating the types of digital experiences we can plan and build. Final strategy, design, features, scope, timeline, and pricing are tailored to each client.
The business problem
Leadership decisions wait on stitched-together reports that disagree with each other.
Proposed solution
Automated pipelines into a single KPI layer: sales, operations, and finance views, anomaly flags, and AI-written 'what changed this week' summaries.
Key features
✓ Unified KPI layer
✓ Sales/Ops/Finance views
✓ Anomaly flags
✓ AI weekly summaries
✓ Drill-down to source
✓ Scheduled email digests
User journey
- 1Monday digest lands
- 2Leader opens the moved metric
- 3Drills to the source record
- 4Decision made with confidence
Admin & operations
- • Metric definitions
- • Source connections
- • Access control
Technology approach
Suggested development phases
Phase 1 — Truth
Top 10 KPIs from live sources.
Phase 2 — Watch
Anomalies + digests.
Phase 3 — Explain
AI summaries + drill-downs.
Every element above can be customized — pricing is confirmed after scope review.
Make this concept yours
Pick what matters for your business. We'll carry your choices into the free assessment so your roadmap starts from your requirements — not a template.
From this concept
Common additions
No payment required · human review before anything is final · pricing confirmed after scope review.
Like this direction?
Our consultant can review your goals, identify the right first phase, and prepare a tailored scope, timeline, and pricing plan. No payment required · human review · start with a manageable first phase.